Following a brief market pullback, we surveyed all Fidelity technology funds based on their performance during the selloff and their relative performance compared to the broad market indexes to identify the top three sector funds that we think are the most likely to continue to perform well in 2021.
Chart 1. The tech heavy Nasdaq index is on the verge of breaking out after a brief pullback.
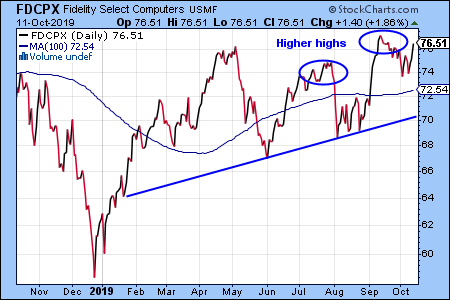
Chart 2. The Fidelity Select Computers Fund (FDCPX) corrected to a lesser degree than the broad market and now poised to move higher.
Chart 3. The Fidelity Select Communications Equipment Fund (FSDCX) is outperforming the market. The accelerated switch to 5G technologies can continue to fuel the growth of this fund.
Chart 4. The Fidelity Select Semiconductors Fund (FSELX) invests in one of the hottest technology sub-sectors. The recent shortage of computer chips in the auto industry underlines the growth potential of semiconductors.
The steep rise of the Treasury note and long-term Treasury bond yields caused a sharp selloff in most equity sectors
Technology experienced the largest decline, but a short-term oversold rally is likely
Natural resources and financials continue to gain, despite the market weakness
A combination of faster than expected economic recovery from the pandemic, new fiscal stimulus, and accommodative monetary policy raised inflation expectations that resulted in a rapid increase in yields (Chart 1).
Chart 1.
Higher bond yields also caused a sharp selloff in technology. Chart 2. shows that the technology-focused Nasdaq index is nearing its trend support that increases the likelihood of at least a short-term oversold rally. However, if yields continue to rebound towards the historical levels, the selloff can resume too.
Chart 2.
Natural resources, including energy, is the best performing industry group due to expectations of a quick worldwide economic recovery, limited supply increases, and the weakness in the U.S. dollar. Within this group, the Fidelity Select Energy Services (FSESX) is the best performing sector fund (Chart 3).
Chart 3.
Financials have also gained in a weak market environment due to the steepening of the yield curve that benefits banks and other sectors in this group. I highlight here the Fidelity Select Banking Fund (FSRBX), as the top performer (Chart 4).
The S&P 500 index continued the bullish momentum in the first weeks of 2021 and made a new record high at the end of last week. We are cautiously bullish, as the combination of the rollout of COVID19 vaccinations, expectations for additional fiscal stimulus, and a rebounding economy can continue to fuel the gains. However, in our view, international tensions and the uncertainty around anticipated tax legislation can become headwinds for the equity market.
Chart 1.
Steadily rising interest rates caused long-term Treasury bonds to enter a declining trend starting in August 2020. This declining trend continued in January 2021 (Chart 2).
Chart 2.
While large-cap technology and other growth investments received most of the attention in recent months, we’d like to note that value stocks have outperformed the large-cap S&P 500 index (Chart 3). We think that this is largely due to money coming out of declining bond investments. In essence, dividend-paying value stocks are taking the place of traditional income-oriented bond funds.
Chart 3.
Small-caps are also outperforming large-caps since the lows of the COVID19-related market panic in March 2020 (Chart 4). Since smaller capitalization companies were impacted more severely in the pandemic, a rebounding post-covid economy makes small-cap stocks more attractive, as a group.
Chart 4.
We see the declining trend for the U.S. dollar vs. the basket of major currencies continuing, but the weakness will probably depend on the extent and frequency of the fiscal stimulus and changes in monetary policy.
Chart 6.
In part due to the weakening dollar and part due to the strengthening global economy, natural resources are in a rising trend. I’d like to highlight here the benchmark West Texas Intermediate Crude (WTIC) oil. WTIC hovered in a broad trading range between August and November of last year but started a steady climb after the first positive news about the COVID19 vaccines became available (Chart 5). We would not be surprised to see natural resources performing well in 2021.
Chart 5.
International markets are also providing exciting performance currently with emerging markets leading the way (Chart 7), as economies in Southeast Asia seem to recover faster from the pandemic than the U.S., and Latin American economies benefitting from the natural resources boom.
Chart 7.
European markets are starting to lag the S&P 500 index (Chart 8), probably due to a slower pace of the vaccinations, and the short-term economic disruption caused by BREXIT. A notable exceptions are Southern European countries, such as Italy and Greece, which will benefit from increased tourism post-covid.
The comparison of the three-month returns of the 40 Fidelity Select sector funds shows a wide performance gap between the best and the worst sectors:
Investments in natural resources gained the most. The combination of the rollout of COVID19 vaccinations, expectations for additional fiscal stimulus, and a rebounding economy can continue to fuel the gains, in our view. In this group, the Fidelity Select Energy Services Fund (FSESX) is the top performer (Chart 1).
Chart 1.
Higher interest rates and the steepening of the yield curve benefitted stocks in financial services. The Fidelity Select Banking Fund (FSRBX) shows the best gain in this group (Chart 2).
Chart 2.
The rebound of economic activity, higher savings rates, and anticipated easing of the pandemic related restrictions can further increase consumer spending. Travel and other leisure investments are especially poised for a rebound. We think that the Fidelity Select Consumer Discretionary Fund (FSCPX) is positioned well for a strong performance in 2021 (chart 4).
Chart 3.
The weakest sector fund in our survey is the Fidelity Select Gold Fund (FSAGX), as the relative performance of gold stocks vs. the S&P 500 index (shown in the bottom panel of Chart 4) continues to trend lower.
Many investment advisors and asset managers like to incorporate a 3-5% asset allocation for alternative investments in their long-term strategies. In theory, alternative investments can provide uncorrelated returns compared to bonds and stocks, which can reduce portfolio drawdowns and volatility.
Gold, being a scarce metal, has been used since the beginnings of humanity as a store of value and also as a display of wealth in the form of jewelry. Gold is also known as a safe haven investment in times when increased inflation is anticipated by market participants.
While we see merit in the argument that the rapidly increasing national depth coupled with close to zero, or possibly below zero interest rates in the future has the possibility of creating an unexpected jump in inflation, we do not see gold bullion and gold mining stocks rallying right now (Chart 1).
Chart 1.
Bitcoin (Chart 2) emerged recently as a pseudo competitor for gold. Proponents of bitcoin say that it disrupts gold. While bitcoin has a scarcity value similar to gold, we think that its main current use is for speculation, not for long-term investment. There are also signs of potential regulatory hurdles ahead in the near future.
Chart 2.
In our view, commodities are the most interesting of the alternative asset classes today. Since many of the commodities, such as oil and metals are priced in dollars, the weakening U.S. dollar is creating a tailwind. One of the most interesting Fidelity mutual funds in this space is the Fidelity Commodity Stock Index Fund (FFGCX). The fund invests in stocks of companies engaged in metals, energy, and agriculture industries, and is likely to continue to outperform, in our view (Chart 3).
Following the stock market crash triggered by the COVID19 crisis in March 2020, the U.S. dollar started to decline compared to the basket of major currencies (Chart 1).
Chart 1.
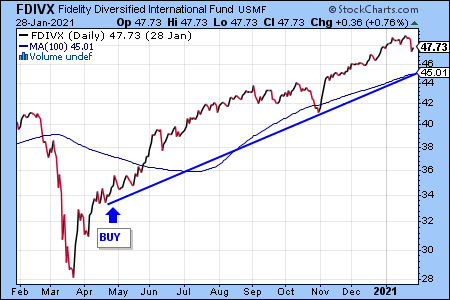
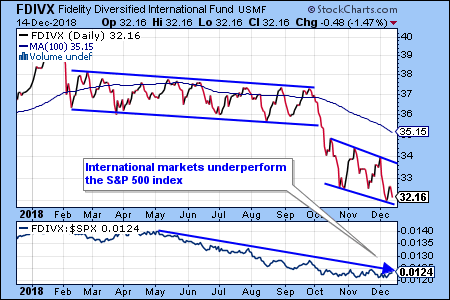
The declining dollar makes international investments attractive for U.S. investors. We think that if the dollar continues to decline in 2021, the Fidelity Diversified International Fund (FDIVX) will continue to perform well (Chart 2).
Chart 2.
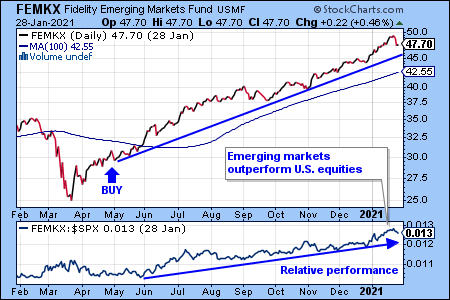
Emerging markets have outperformed developed markets in Europe and the U.S. since the market recovery started in May of 2019. The Fidelity Emerging Markets Fund (FEMKX) has a stellar long-term track record and may be a great way to play the continuation of this trend (Chart 3).
Chart 3.
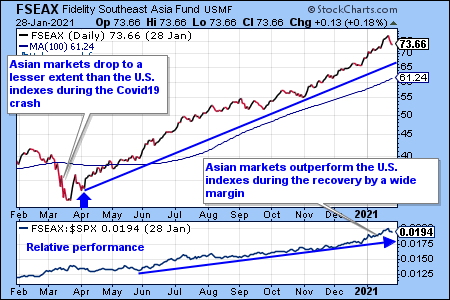
For aggressive investors, the rapid growth of Asian markets can offer an appealing opportunity. Asian markets declined to a lesser extent during the COVID19 market crash than the U.S. market and recovered faster in the aftermath. The chart of the Fidelity Southeast Asia Fund (FSEAX) shows how strong and steady this trend has been (Chart 4).
Chart 4.
As a word of caution, we’d like to remind our readers that in our view, global stock markets are highly overbought right now due to the combination of large fiscal stimuli, and dovish monetary policy. Consequently, we anticipate a correction in the near future. However, we think that the trends of relative outperformance by international markets can continue in 2021, and investors will likely have an opportunity to buy at lower prices.
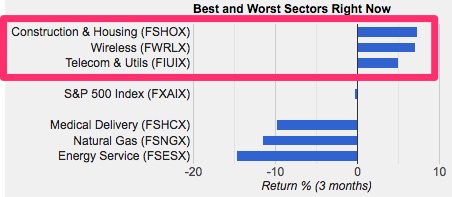
A technical screen of all Fidelity sectors mutual funds shows that only three sector funds were able to make new highs after the late July selloff, while consistently outperforming the S&P 500 index throughout 2019
In our view, these sector funds can continue to outperform in the last three months of 2019, while offering lower investment risks than other sectors
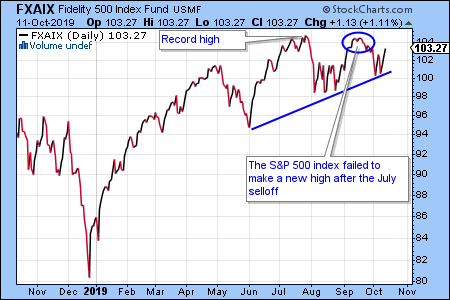
The S&P 500 index was not able to reach a new record high in September after the late July selloff:
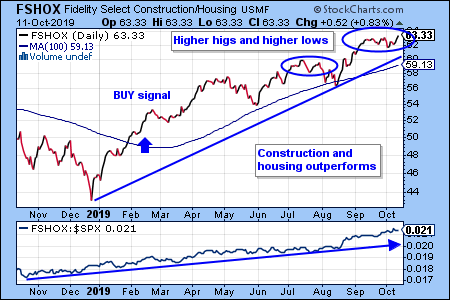
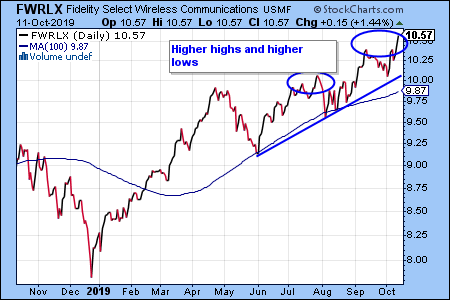
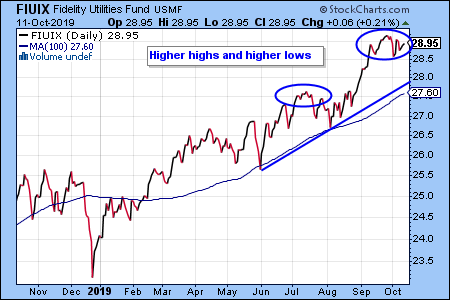
To identify the best investment opportunities in the current market environment, we performed a momentum screen of all Fidelity select sector funds using the three-month total return. The screen showed that the Construction & Housing (FSHOX), the Wireless (FWRLX) and the Telecom and Utilities (FIUIX) funds are the leading investments right now:
We found that these sector funds were able to break out to new highs and continue to advance in spite of the recent stock market volatility and fluctuations in interest rates. We think that this trend is due to the continued flow of money into these sectors by risk-averse institutional investors, and will likely continue into early 2020.
Cyclical growth sectors can produce attractive returns when the market sentiment turns bullish. In our view, the Fidelity Select Computers (FDCPX) fund stands out in this category by being able to make a new record high after the July selloff:
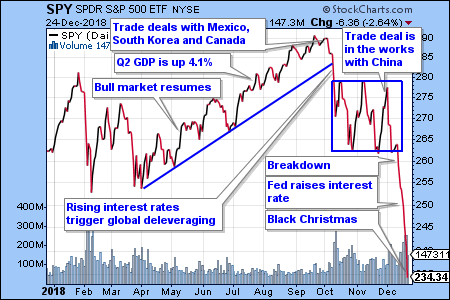
The S&P 500 index dropped 2.64% yesterday and lost more than 20% of its value compared to the recent peak:
In previous articles, we described that crash-like conditions were developing. In our view, we are witnessing a slow-motion stock market crash that possibly forecasts a global economic slowdown.
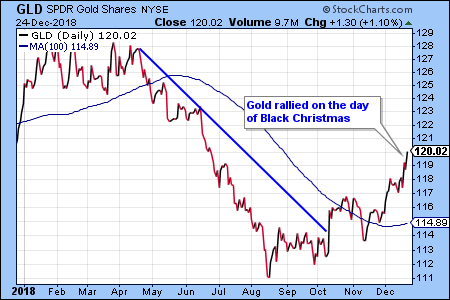
Yesterday, the panic selling impacted almost all asset classes, with the exception of gold and Treasury bonds, which are traditionally viewed as “flight to safety” trades.
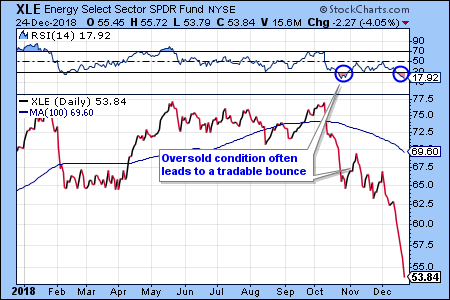
In our view, the most oversold sectors will likely bounce in the coming days and may offer a short-term buying opportunity to aggressive traders.
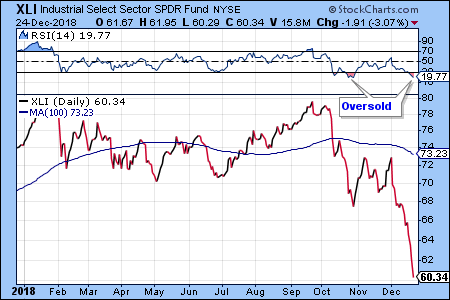
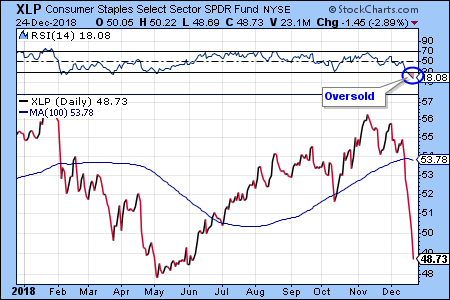
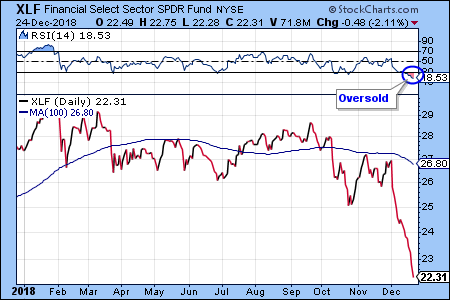
To identify the most oversold sectors, we use the Relative Strength Index (RSI) indicator. When the value of the RSI is less than 30, we regard the investment as oversold (denoted with blue circles on the charts). When the RSI is less than 20, the investment becomes highly oversold.
Out of the 11 largest U.S. sectors, the energy, the industrials, the consumer staples, and the financials dropped the most yesterday, while also triggering the highly oversold condition:
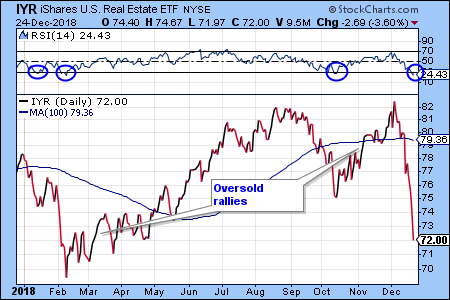
The real estate sector is oversold, as well, and we think that this sector also has the potential for a short-term rally:
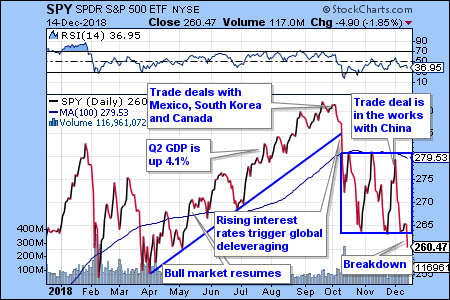
The S&P 500 index broke below its trading range Friday, which is the latest sign of the deterioration of the U.S. stock market:
Investor pessimism is driven by the slowing growth of the global economy, rising interest rates, trade wars, the Brexit negotiations, and several other geopolitical factors. We think that we are at an inflection point and crash-like conditions can develop quickly.
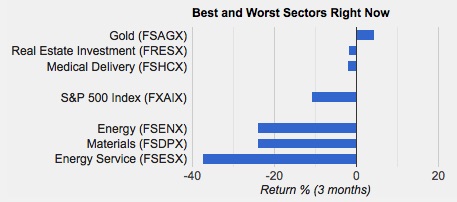
A worrisome sign for us is the lack of sector leadership. Gold is the only sector that shows a positive return for the last three months:
While the Fidelity Select Gold Fund (FSAGX) has outperformed recently, the chart does not show a bullish price pattern yet. FSAGX will have to break above the long-term trendline to start a new bullish trend:
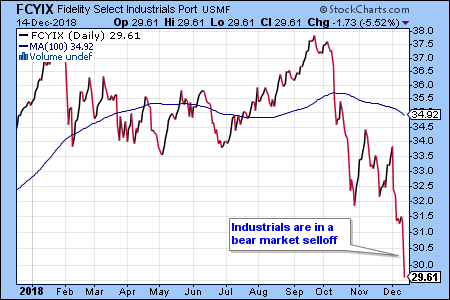
On the other hand, the chart patterns of the weakest U.S. sectors, such as energy and industrials, are very negative:
In a previous article, we described the turmoil in global markets. European and Emerging Markets continued to deteriorate since then and do not offer investment opportunities at this point in our view:
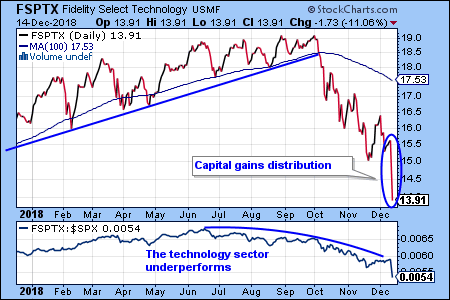
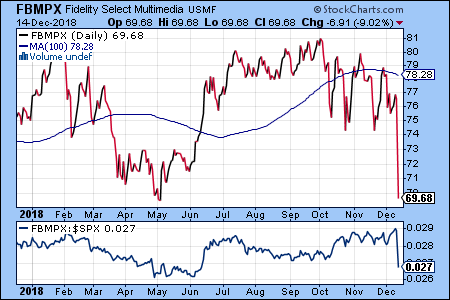
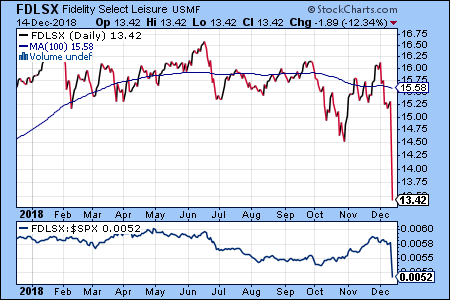
The large price drops of several Fidelity funds at the end of the Friday trading session were due to the distribution of capital gains, which happens periodically. The details are provided by Fidelity at https://www.fidelity.com/mutual-funds/information/year-end.