Long-Term Bullish Trend is Intact for U.S. Equities, in spite of Increased Volatility; Gold Forms a Bullish Double-Bottom Chart Pattern; It is Still Early to Invest in the Energy Sector or in International Equities;

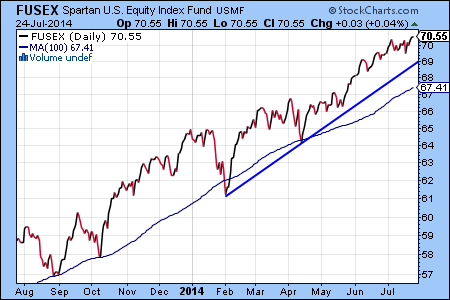
It is always good to take a look at long-term trends when short-term volatility increases, in order to have a better sense of the market direction. While the widely anticipated stock market correction remains a possibility, in our view, the long-term bullish trend for U.S. equities is still intact.

The chart shows that the multi-year uptrend for the benchmark Fidelity Spartan U.S. Equity Index Fund (FUSEX) has not yet been interrupted by the recent market volatility:

fusex

In a recent article (see Best Fidelity Mutual Funds for 2015) we highlighted the most attractive investments for 2015. The selected mutual funds have continued to perform well in the last few weeks of trading. Especially, conservative sectors, such as real estate, utilities, medical equipment and consumer staples have outperformed the S&P 500 index:

frifx

fsutx

fsmex

fdfax

Perhaps, the most interesting new development in 2015 is the renewed interest in buying gold mining stocks. The chart of the Fidelity Select Gold Fund (FSAGX) below shows a short-term bullish double bottom pattern and increased buying activity during the first two weeks of the New Year. However, gold has a long way to go before it can establish a long-term uptrend.

While gold is traditionally viewed as an inflation hedge, in the current deflationary environment precious metals are looked at as an alternate asset class that can potentially serve as a volatility hedge. We’d like to caution investors, that while gold can provide returns that have low correlation with equities, this sector is highly speculative and is more appropriate for the purposes of short-term trading than long-term investing.

fsagx

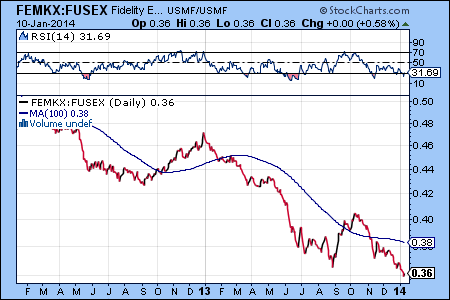
As noted in earlier articles, we believe that it is still too early to diversify into the weakest sectors, such as natural resources (in particular energy), and into underperforming international markets.

The blue lines on the charts of the Fidelity Select Energy Fund (FSENX) and the Fidelity Latin America Fund (FLATX) indicate that the bearish downtrends that are still in place:

fsenx

flatx

Read more about investment strategies involving these funds at FidelitySignal.com

.

The Defense Sector Lags the Market

The earnings season often brings volatility for equities, but this summer the bullish trend stayed uninterrupted for the S&P 500 index. The benchmark Fidelity Spartan U.S. Equity Index Fund (FUSEX) has gained an impressive 5.85% return in the last three months:

fusex

The Fidelity Select Defense/Aerospace Fund (FSDAX) is the weakest performing Fidelity fund with a -2.63% year-to-date return. The chart below shows that the relative strength of this sector has been declining since the January correction. The chart pattern is negative, as well. We would avoid investing in this sector until FSDAX regains its momentum and moves above the 100-day moving average line.

fsdax

Sector Rotation: Gold and Utilities Stocks are Poised to Advance; Avoid the Telecommunications Sector

Equity markets  sold off this week due to worries about the escalation of the Ukraine situation and the fears about the potential weakening of the Chinese economy.

Few sector funds are making higher highs in this negative market environment of the last few days. We highlight here Fidelity funds corresponding two sectors, gold and utilities, which show the strongest relative strength compared to our benchmark Fidelity Spartan U.S. Equity Index Fund (FUSEX).

fsagx

fsutx

Both the price action and the declining relative strength line (the ratio of the investment versus the S&P500 index) shows that the telecommunications sector is one of the weakest equity sectors right now. We would avoid investing in this sector based on current conditions.

fstcx

Buy and sell signals are available at FidelitySignal.com

.

Sector Rotation: Real Estate, Healthcare, Technology and Gold Funds are Emerging as the Strongest Investments in the Current Market Environment

While the benchmark Fidelity Spartan U.S. Equity Index Fund (FUSEX), which is Fidelity’s S&P 500 index fund, barely moved higher today, multiple sector funds continue to show increased relative strength and may become promising equity investments for the next weeks or months. The first chart shows that FUSEX bounced off of the blue support line following the January market sell off and just barely holding above the 100-day moving average:

fusex

The next chart shows that Fidelity Real Estate Fund (FRESX) is one of the most interesting opportunities to watch for in the next few weeks. The top part of the chart displays the relative strength, which is the ratio of FRESX versus the S&P 500 index. The blue arrow indicates that the relative strength is improving for this sector starting from the beginning of January. Indeed, FRESX did not correct as much as FUSEX in the recent sell off and has already broken out to a new high for the year. The 1-year chart also shows that FRESX has not yet established a clear bullish trend, but the price action is promising.

fresx

The long-term picture for the technology and healthcare sectors is very different from real estate, as these large sectors have performed very well last year, but did not correct hard in January, and their relative performance compared to the broad market indexes continue to improve. Fidelity has multiple select funds for both of these sectors. We show here two examples of health care funds (FSPHX and FSMEX), which continue to provide excellent returns:

fsphx

fsmex

The following two charts show examples of two Fidelity technology funds (FSELX and FSPTX) with increasing relative strength and promising outlook:

fselx

fsptx

One of the most interesting recent developments has been the strong rally of gold mining stocks. As the result, the Fidelity Select Gold Fund (FSAGX) has gained 11.74% already this year.  The five year chart below shows that FSAGX reached its peak in 2011, but dropped in the following year and a half by almost 68% to reach the most recent low in last December. The blue downtrend line appears to be broken now, but since the gold mining sector can be highly volatile, investors should be very cautious with taking large positions in this sector until a clear uptrend gets established. For example, in the second half of 2012 gold made a similar bullish move, but resumed its bear market for another year:

fsagx

Source: FidelitySignal.com

.

Emerging Markets Underperform

The chart below shows the relationship between the Fidelity Emerging Markets Fund (FEMKX) and the Fidelity Spartan 500 Index Fund (FUSEX) by plotting the ratio of the two over the last two years. The declining line is an indication of the continuing underperformance of emerging markets compared to U.S. equities.

femkx-fusex

Taking a closer look at the chart of FEMKX helps us understand the underperformance. While U.S. equities are currently in a strong bull market, the FEMKX chart looks anything but bullish.

femkx

View buy and sell signals at FidelitySignal.com

.

Equity Markets Rally on the Announcement of the Fed’s QE3 Tapering Decision; Higher Yields Cause Treasury Bonds to Continue Bear Market

Well, it finally happened. The Fed announced today that it will start reducing its Quantitative Easing (QE3) program by tapering the bond purchases from $85 to $75 billion a month, starting in January 2014. The Fed also reassured investors that it will keep interest rates low for the foreseeable future.

The stock market reacted positively: the Fidelity Spartan 500 Index Fund made a new all-time high today and almost all equity funds closed up. The notable exception is the gold mining sector that continues its bear market.

fusex

The announcement pushed the yield on the 10–year treasuries higher, which in turn caused the Fidelity Spartan Long-Term Treasury Bond Fund (FLBIX) to go lower. We would continue to avoid investing in FLBIX until this long-term trend reverses.

tnx

flbix

Buy/sell signals for Fidelity funds are available at FidelitySignal.com

.

Stock Market at All Time High Again

aaa

Both the Dow Industrial  and the S&P 500 indexes are in uncharted territory again. Fidelity’s Spartan U.S. Equity Index Fund (FUSEX) has been one of the best ways to participate in the bull market for stocks in 2013.


Buy/sell signals for Fidelity funds are available at FidelitySignal.com 


The Stock Market Continues the Bull Move

FUSEX

The Fidelity Spartan 500 Index Fund (FUSEX, last change: 2.06%) has made a new high and continues to gain momentum.

IWM

On a cautionary note, we’d also like to see the iShares Russell 2000 Index ETF (IWM) moving to a new 52-week high to confirm the rally in U.S. equities.

Technical analysis screens are provided by FidelitySignal.com 

Panic selling of 2011 continues: U.S. stocks break down

We have warned about the risk of U.S. stocks moving lower in the fall season following the panic selling in early August. Unfortunately, our benchmark S&P 500 index fund moved below its support level today, breaking its support level.

Fidelity Spartan 500 Index fund (FUSEX, change: -2.86%)

Fidelity Spartan 500 Index fund (FUSEX, change: -2.86%)

http://fidelitysignal.com/aug_2011